 |
 |
|||||
| PRODUCTS | |
| LSSS | |
| Work process overview | |
| Key features | |
| Input data | |
| Interpretation overview | |
| Interpretation tools | |
| Interpretation format | |
| References | |
The goal of interpretation is to mark layers and regions and assign the associated percentages of species present. In order to perform this task, the interpreter needs to combine past experiences and knowledge with the use of the available interpretation tools. Several tools have been developed in terms of windows that can be turned on or off according to needs in different interpretation sessions. In this way, LSSS can be adapted to the variations of interpretation workflows used in different organizations. The most important windows are described below.
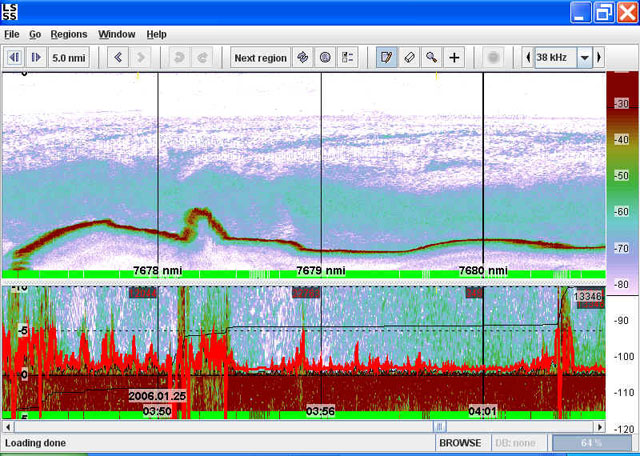
Echogram window and bottom window
This window is normally the largest, and shows the echogram for the selected region and for a selected frequency.
Layers and regions can be drawn in this window, that is always turned on.
Since many species are located close to the sea floor, and since echos are often difficult to interpret in this area,
the bottom window has been developed in order to enable better focusing on important details.
However, if the interpretation session only includes pelagic species,
the bottom window can be turned off by switching to the so-called "Pelagic mode" (as opposed to "Full mode").
Layers and regions can also be interpreted in the bottom window.
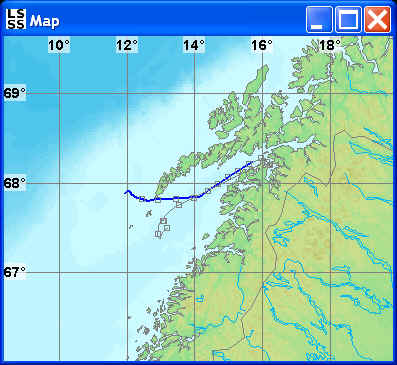
Map window
This window shows a chart for the survey area, and the ship route.
The window has two important functions.
Firstly, a marker shows corresponding positions in the map and the echogram/bottom window.
Secondly, it is possible to move a marker along the ship route
and click at new spots where the interpreter wants to study echograms.
In this way, the map becomes a portal into the survey database.
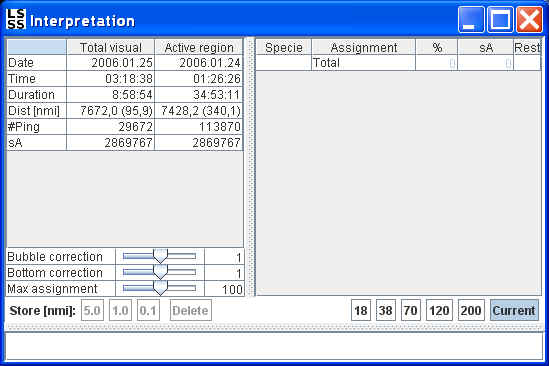
Interpretation window
This window shows some information about the echogram data currently being displayed,
and the list of biological species to be considered in the interpretation process.
After having drawn layers and regions, the interpreter assign the associated percentages of different species by means of this window.
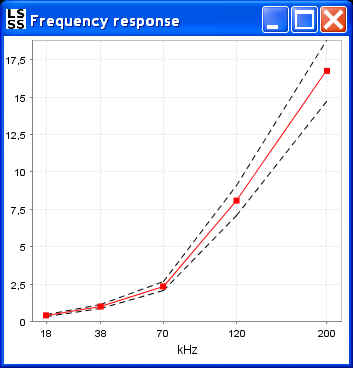
Frequency response window
When using several frequencies in the interpretation, the interpreter needs to know that each frequency has reliable data.
This is true if the response curves from all frequencies have close to the same shapes.
If one or several frequencies deviates significantly, the data may be unreliable.
The reason for such deviations can for example be that the acoustic processing was not able to detect bottom.
The interpreter can then choose to perform noise reduction or omit the unreliable data from further analysis.
The frequency response window can also be used to verify information in the data on a more general level,
since fish with swimbladder, fish without swimbladder, and plankton has very characteristic frequency response curves.
Sometimes, these curves can be very clear and give strong indication for presence of a certain species.
Other times, the curves may express superimposed frequency responses from several species.
In such cases, a trained interpreter will then be able to classify schools with a mixture of species and estimate
the percentwise distribution of each species.
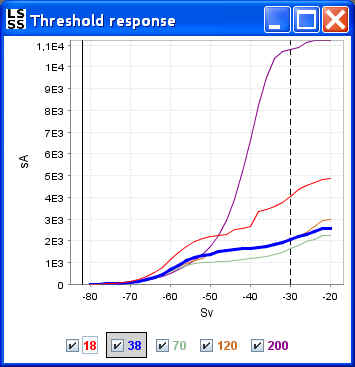
Threshold response window
In some cases, interpretation is easier if the low signals and/or the high signals can be removed from the echogram.
This is possible to do by means of the threshold response window.
In practice the interpreter will first study the curves in the frequency response window,
and then adjust the low and/or the high threshold values.
These values are adjusted by moving the upper and lower limits of the color table normally shown to the right of the echogram/bottom window.
In the threshold response window, these limits are indicated by the thin vertical solid and dotted lines respectively.
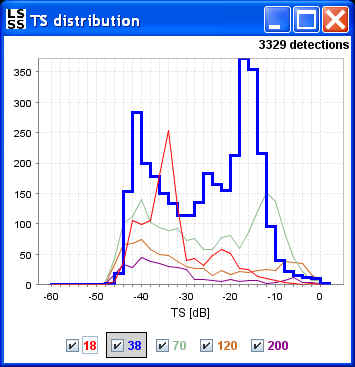
TS-window
By plotting the number of fish as a function of the measured target strength (TS),
it is possible to extract information about the sizes of the fish being interpreted.
This is possible since there is a quite clear relationship between measured TS and the length of the swimbladder.
In practice, the interpreter will typically use the TS-histogram to determine what kind of fish there can be in a region,
and equally important what kind of fish that can't be present in a region.
If the histogram has several peaks, this can also be an indication of a mix of species inside the region being studied.
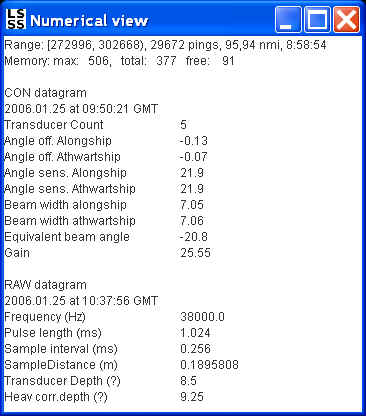
Numerical view
This window shows numerical information about current survey.
It contains two sections. The "CON datagram" shows some of the important parameters for the configuration of the echo sounder.
This section is fixed for the entire survey.
The "RAW datagram" shows numerical information about a specific ping in the current survey selected by means of the cursor.
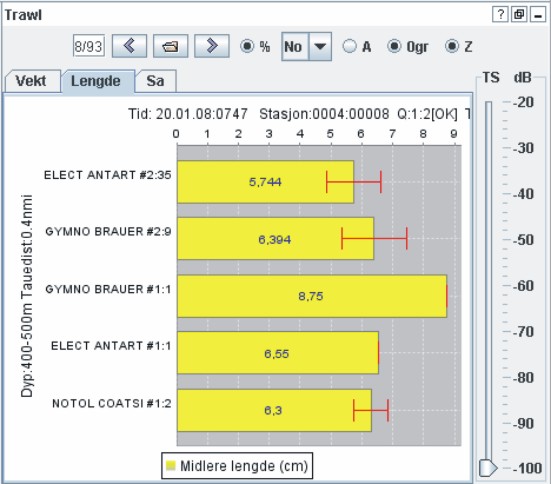
Trawl window
When LSSS is used for marine stock assessment, it is possible to perform combined analysis of trawl samples and acoustic data. The trawl window shows graphical displays of different parameters, such as average weights and average lengths for different species.
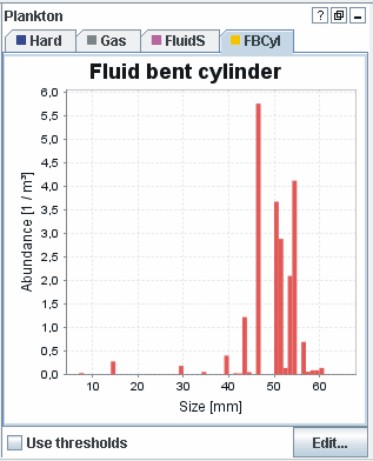
Plankton window
LSSS has extensive functionality for biomass estimation of different types of plankton. The plankton window can be used to study various parameters related to a selected region of plankton in the echogram window, such as average size.
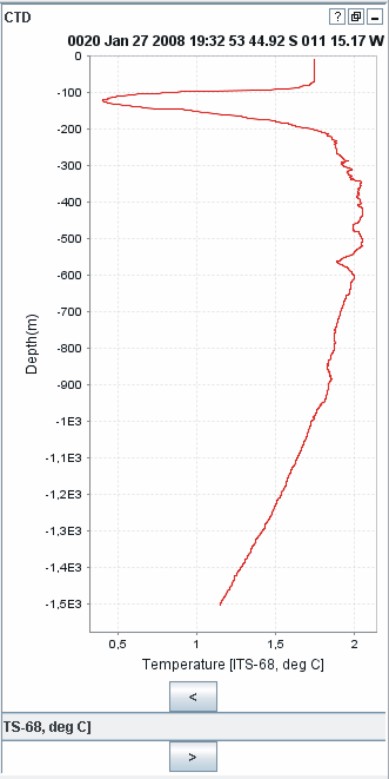
CTD window (Conductivity Temperature Depth)
This window can be used to study measurements of temperature, salt, and pressure at selected points in time during the survey.
Other tools and functionalities
The functionality in LSSS is gradually extended. One important extension is to develop support for SIMRAD's multi-beam sonar, the MS70. This functionality is expected in a future LSSS release, and will include region growing, 3D and 4D visualization of schools, as well as biomass estimation based upon 3D representations of schools.
Please send a request to info@marec.no if you are interested in information about other tools in LSSS, or the new 3D functionality related to SIMRAD MS70.